"Since December 2015, investors have had a difficult time digesting rate hikes in the immediate days and weeks following a rate increase... a short-term 10% correction could be a worst-case scenario... A sideways grind, with a milder drawdown and resistance in the SPDR S&P 500 ETF Trust (SPY) $244-$245 area into the next Fed meeting in late July, would be considered a best-case scenario."
-- Monday Morning Outlook, June 19, 2017
"In the minutes of the June Fed meeting, some officials 'expressed concern that subdued market volatility, coupled with a low equity premium, could lead to a buildup of risks to financial stability.'... Worries about rising asset prices were echoed in public comments by Fed Chairwoman Janet Yellen, Vice Chairman Stanley Fischer, and San Francisco Fed Bank President John Williams."
-- The Wall Street Journal, July 7, 2017
Whether it is headlines related to North Korean missile tests, a more than two-hour meeting between Russian President Vladimir Putin and U.S. President Donald Trump, the release of the Federal Open Market Committee (FOMC) minutes for June, or central bankers hinting at their next policy move and making public their worries about asset prices, equities -- as measured by the S&P 500 Index (SPX - 2,425.18) or the SPDR S&P 500 ETF Trust (SPY - 242.11) -- have been grinding modestly lower since the mid-June rate hike.
The SPY, for example, has run into "Federal Reserve resistance" in the $244-$245 area, which is where it was trading in mid-June. Support since mid-June has emerged at the round $240 area, with a second test of this level occurring for the second time in as many weeks last week. The round $240 region marked resistance earlier in the year, and represents a 61.8% retracement from early May (when the Fed last met and did not raise rates) and the mid-June FOMC meeting, which marked a top so far. SPY's 60-day moving average, which represents roughly three months' worth of trading, also resides in the $240 area.
In other words, the price action we are witnessing is not any different from that which we saw after the mid-December 2016 and mid-March Fed rate hikes. The good news for bulls is that the drawdown has been muted. Plus, there is the potential that after the late-July meeting, if the Fed does not raise rates, stocks will break out above the most recent resistance levels, as they have done following other Fed meetings when rates were kept steady. But as I discussed last week, seasonality isn't exactly favorable, and central bankers continue to hint at further interest rate increases, even as there are no hints of inflation. A directionless market could continue to be the order of the day.
As the SPY does its thing, other benchmarks have behaved similarly, with the S&P MidCap 400 Index (MID - 1,747.36) facing "Fed day" resistance at the 1,750 half-century level. Meanwhile, the Russell 2000 Index (RUT - 1,415.84) has been unable to overtake Fed-day resistance at 1,420, but the round 1,400 area has served as support since the meeting.

"... after a close above the $142 level on the first Friday in June, the tech-heavy PowerShares QQQ Trust (QQQ - 139.98) retreated significantly below this level last Friday. I view this level as important because $142 is the site of the last significant call open interest strike in the June expiration series. Moreover, $142.26 is 50% above last year's closing low and 20% above the 2016 close -- round-number returns that may create hesitation among would-be buyers, and/or spark selling among those seeking to lock in some profits."
-- Monday Morning Outlook, June 12, 2017
The recently weak price action in big-cap technology stocks has taken up a lot of media attention. likely due to the heavy technology weighting in broader indexes. I thought this might be an interesting time to discuss potential levels of support, after noting the PowerShares QQQ Trust's (QQQ - 137.76) failure at the $142 resistance level around this time last month.
The QQQ comes into the week trading just above the $136 level, which marked a bottom in May, thus setting up the potential for a "double-bottom" pattern to emerge. The $136 level is also home to its 80-day moving average, a technical level that is not widely tracked among traders. But we have seen this trendline mark support in enough instances that we pay close attention to it. In other words, while there may be a large segment of traders who sold when the QQQ broke below its 50-day moving average, the 80-day moving average may have more importance during the longer-term uptrend.

I am also focusing on the 134-136 strikes because, as you can see on the bar graph below, there is considerable put open interest that has built up on options expiring in the standard July series. A break of the 136 strike would likely lead to a decline to at least the 134 strike, home of the last heavy put open interest.
However, the longer the QQQ can remain above these heavy put strikes as standard options expiration approaches on July 21, the more likely it is to experience a tailwind from short covering related to these heavy put open interest strikes. This could make the recently maligned large-cap technology group likely to experience a drift higher in coming weeks. A move to the round 140 strike is one scenario, as this is the site of heavy call and put open interest, as well as a trendline that connects the June highs.

Loyal readers know that I am fascinated with round numbers and round-number percentage gains and losses from major highs or lows. These often mark "profit taking" or "bargain" prices, and are thus more apt to mark hesitation and/or pivot zones.
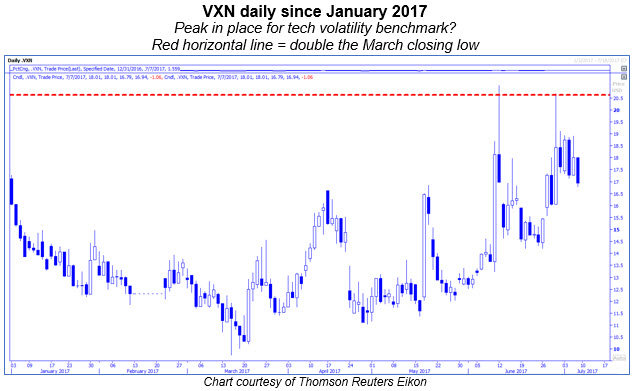
With that said, note how the CBOE Nasdaq-100 Volatility Index (VXN - 16.81) bottomed at the round 10 level in March. This trough in volatility marked the beginning of sideways price action for the QQQ as the volatility measure grinded higher. In mid-April, the QQQ broke out of its consolidation phase and moved higher around the same time that the VXN was a round 50% above its low in mid-April.
This could be of interest because the VXN highs in June were in the zone that is double the intraday and closing lows in March 2017. With the VXN declining from its "double-low," it may hint that the worst of the tech sell-off is over -- at least for now, anyway.
"The energy sector is still one to avoid, despite its bounce last week. Many notable banks reduced their target price forecasts for oil, but these downward revisions largely just reflected the sell-off in crude oil that they did not anticipate. The bottom line is that there are still many energy bulls that are underwater and in 'hope' mode."
-- Monday Morning Outlook, July 3, 2017
Continue to avoid the energy group, as the Energy Select Sector SPDR Fund (XLE - 64.01) made another 52-week low on Friday, after touching a trendline connecting lower highs at the start of last week's trading. Despite the steady trend lower since mid-December, with the fund almost 20% below the December 2016 high, there were inflows into the XLE in June even as the fund suffered another losing month. The XLE's $62-$63 area could be a hesitation point in the trend lower, as this area is 20% above the 2016 low and 20% below the 2017 high.
Continue reading: