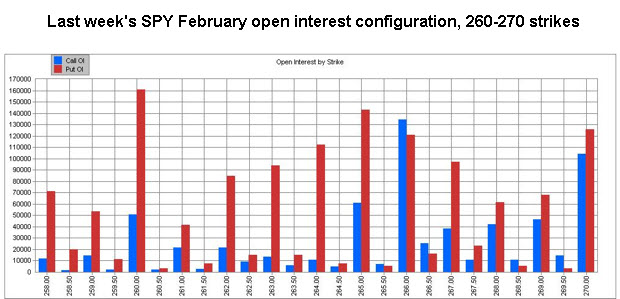
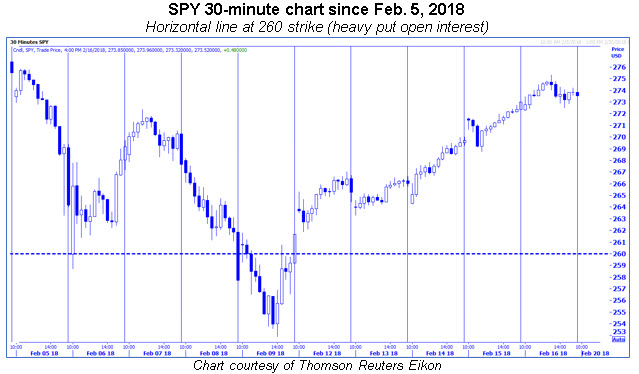
"To the degree computers were taking cues off volatility, sell programs were likely tripped, causing major losses in the equity market. And as I've cautioned before, once there is a 'trigger' to destabilize equities, the never-ending put open interest that builds up below the market month after month on equity exchange-traded funds (ETFs), such as the SPY, can become magnets. This is likely what we witnessed as the 'after-effect' of the 'volatility event' last week...
"...keep in mind that it is options expiration week, and if the SPY moves back below $260, the delta-hedge selling risk remains. That said, the longer SPY remains above this heavy put open interest strike, short covering becomes a possibility, as short positions related to put open interest at strikes below the SPY's value are unwound as expiration nears."
-- Monday Morning Outlook, February 12, 2018
Judging by the action in equities last week -- in which the S&P 500 Index (SPX - 2,732.22) and SPDR S&P 500 ETF Trust (SPY - 273.11) sprinted about 4% higher after the prior week's 6.5% setback -- it appears options put open interest on equity index and exchange-traded funds (ETFs) again influenced the magnitude of the market's directional move. The SPX has traveled extensively since its Jan. 26 high, moving a total of roughly 540 points from high to low, and then from that low to last week's close.
Whereas heavy put open interest likely sparked delta-hedge selling the week prior, the late-afternoon rally on Friday, Feb. 9, set the equity market up for a short-covering rally related to expiring put open interest in the standard February series at the very strikes that acted as magnets in the week prior. In other words, as the SPY moved above put-heavy strikes and closer to Friday expiration, the put options became less sensitive to the SPY's movement, implying short positions related to these put strikes were unwound, adding fuel to last week's momentum.
In fact, the SPY's advance above $260 was a major factor in kicking the short covering off, as this was by far the heaviest put strike. When the SPY moved through other put strikes above $260, more unwinding of short positions related to the put open interest occurred, spurring a nearly uninterrupted rally in equities. The SPY did stall at the 266 strike late Monday and Tuesday, where both call and put open interest were heavy -- but once through this strike, it was "game on" for bulls until the 273 strike, where it was "pinned" at Friday's close, after a brief move through this strike.

"... large speculators... moved from a net short position of 59,000+ contracts to net long more than 85,000 contracts -- the biggest net long position ever! On the rare occasions when this group has gone long volatility futures, volatility has plunged. The 2017-to-early 2018 volatility risk to equity market participants may now be an opportunity for those looking for an entry into the stock market following last week's volatility event.."
-- Monday Morning Outlook, February 12, 2018
Volatility, as measured by the Cboe Volatility Index (VIX - 19.46), plummeted from the Feb. 9 close of 29.06 to last Friday's close at 19.46. As I said last week, large speculators have historically been caught wrong-footed on volatility moves. This was proven true for the second time in as many weeks, as large speculators on VIX futures came into the week in an extremely rare long position. Luckily (if that is the right word) for those long VIX futures, the March VIX futures contract did not close the prior week as high as the VIX, and thus the decline in this contract was "only" 22% versus the VIX's 33% decline.
"With the VIX in territory not seen for a long time, I am focusing on the 32.08-33.12 area, which is double the 2017 closing high (32.08) and triple 2017's close (33.12). If the VIX remains below this area, and the SPX remains above 2,550, you can emphasize the long side."
-- Monday Morning Outlook, February 12, 2018
I have established that the directional movement and volatility in the last two weeks was likely aided by the options market, specifically by way of delta-hedge selling and the unwinding of short positions related to heavy equity index and ETF put open interest. So now what, after what I described as an opportunity for longs to enter the market early last week?
For short-term traders, and from a technical perspective, we are obviously at a different juncture relative to last week. Expiration has passed, so the options market may not be as influential as it was the past couple of weeks. Moreover, whereas the SPX was coming off long-term support from its 200-day moving average and the VIX was situated just below potential resistance from half its 2018 high and double last year's peak, these two indexes now come into this week nearer potential resistance and support, respectively.
For instance, the SPX high last week was around the half-century mark of 2,750, which coincides with its 20-day moving average -- a trendline it had closed below only once since late August 2017 before the "volatility event" earlier this month sent stocks spiraling lower. Additionally, for Fibonacci followers, the 2,743 level represents a 61.8% Fibonacci retracement of its late-January high and February low.

On a side note, the Russell 2000 Index (RUT - 1,543.55) comes into the week trading just below the half-century 1,550 level, which was resistance in November and December and is also the site of its 40-day moving average, which acted as support in mid-December. Furthermore, the S&P MidCap 400 Index (MID - 1,901.19) comes into the week at the round 1,900 century mark -- resistance in December, and site of its 20-day moving average.
Also on my radar is the VIX, which after making an intraday move below the 18.30-18.66 area -- double the 2018 closing low and half this year's closing high -- closed back above this level on Friday. If you are a short-term trader, beware that the rally could take a pause as the various indexes negotiate the levels discussed above.
The positive for bulls is that the sentiment backdrop suggests there is enough pessimism to be unwound to push the market higher in the weeks ahead. For example, after hitting a multi-year low, the 10-day buy-to-open put/call ratio is back to a multi-month high and now showing evidence of rolling over, which is a good time to be long stocks.
Continue reading: