"I see the 2,700-2,715 area as important not only because 2,700 represents a round century mark, but also because this is the zone where buyers stepped in when the index broke above a trendline connecting a series of lower highs since late January. Additionally, 2,706 is quadruple the SPX bear-market closing low from March 9, 2009, and the mid-April 2018 closing high lies nearby at 2,708. Finally, the 2,715 level is where the SPX was trading on the eve of the March rate hike, and it's a level that acted as short-term resistance in mid-April.
"If you are trading SPY, the 275 strike is the site of more than 150,000 weekly and standard expiration put options that expire between this Friday and standard expiration on July 20. If support at $275 breaks, I would expect the $270-$272 level to be potentially supportive..."
-- Monday Morning Outlook, June 25, 2018
Per the excerpt above, in last week's commentary I focused on potential S&P 500 Index (SPX - 2,718.37) and SPDR S&P 500 ETF Trust (SPY - 271.28) support levels, as I anticipated that equities could continue to give up ground, given the weakness that has generally prevailed in the month following a Fed rate hike in the current tightening cycle.
While trade tensions got the blame for the last week's pullback, the bottom line is that the most recent closing highs on the SPX and SPY occurred on the eve of the June 13 rate hike at 2,787 and $279, respectively.
If you are a short-term bull, the bad news is that stocks pulled back last week. But the good news is that the pullback was contained at the lower end of the support area that I discussed a week ago, and the decline proved to be mild in nature. In my June 11 commentary, I displayed the SPY price action in the month following each hike in interest rates since December 2015. In five of the six instances that stocks declined after the Fed raised rates, weakness was defined mostly as "flat to slightly negative," with one decline of about 9%.
Given the strong rally off anticipated support last week, it appears that the SPY and SPX are shaping up for another flat-to-slightly negative return through mid-July, relative to their respective June 12 closes. Of course, this could change if we see a break of 2,700 sometime between now and standard July options expiration.
In the chart below, note last week's SPX lows in the 2,700 area, which is key support from multiple perspectives, as it's: 1) home to the index's 80-day moving average (resistance in mid-April); 2) the site of the SPX's post-Fed rate hike close in March (circled in red); 3) the breakeven point of the descending triangle breakout in early May; 4) a round century mark; and 5) quadruple its March 2009 bear-market closing low. The question going forward is, "How much, if anything, is left in this bounce?"

It was evident on Friday that if there is follow-through buying, one hurdle to overcome is the SPX's 2,740 level, which was May's intraday high and a 50% retracement of the mid-June high and Thursday's low. If you are trading the SPY, the May high is in the $274 area.
Another thing I find particularly interesting about last week's SPY high and low relates to the SPY options that expired on Friday, June 29 -- which could be labeled weekly or quarterly expiration options, given that quarter-end occurred on a Friday.
The SPY rally from the lows left a boatload of put open interest expiring worthless, while simultaneously a ton of calls overhead expired worthless, mainly at the 275, 279, and 280 strikes. The bulls escaped a potential delta-hedge sell-off when the SPY briefly broke below the 270 strike on Wednesday and Thursday. In fact, the rally off the lows may have been driven by an unwinding of short positions associated with the put open interest. Note that the advance stopped when the SPY was well above the heavy put strikes, and into a call resistance zone.

If SPX 2,740 and SPY $274 are not taken out relatively quickly, you will likely hear from technicians about the potential formation of a bearish head-and-shoulders pattern, with the left shoulder at the site of the May high, the head at the mid-June peak, and the right shoulder at last week's high. The neckline would be around $269, which marks the May and June closing lows. A break of the neckline would target a downside move to the 2,600 area on the SPX and $260 level on the SPY.
For what it's worth, about 170,000 puts reside at the SPY 260 strike in the standard July options expiration series, making this the largest put open interest strike in the front-month series. I'll discuss SPY's July open interest configuration in more detail next week, but suffice it to say that a break of SPX 2,700 or SPY $270 could have dangerous short-term market implications for bulls, whether you are focused on the charts or options open interest.
If the bulls push the SPX above 2,740 and SPY above $274, the next major resistance level in the short term is the June peak that was coincident with the most recent rate hike.
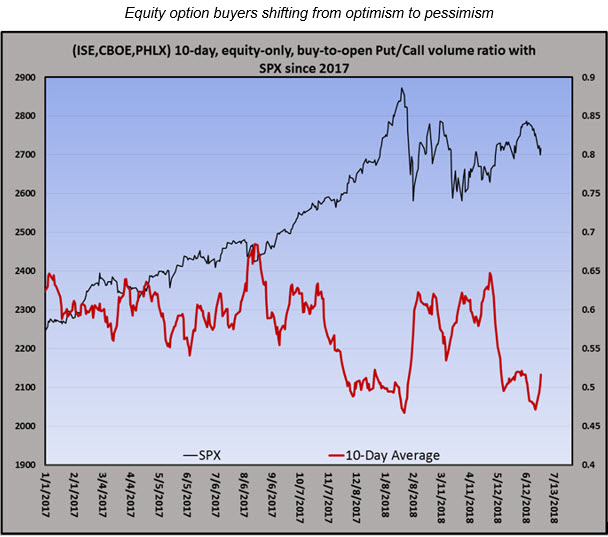
"...the equity put/call volume ratio is now around the levels that preceded the correction earlier this year..."
-- Monday Morning Outlook, June 25, 2018
Finally, there is an additional headwind for the bullish case. That is, the 10-day, equity-only, buy-to-open put/call volume ratio is now headed higher, implying pre-Fed optimism is now turning into pessimism. The risk to bulls is that this change in sentiment could be in its early innings. A potential win for bulls would be a scenario in which equities chop around between support and resistance levels as pessimism builds. But a negative scenario would be equities experiencing another correction like they did in February, when this ratio turned higher from extremely low levels.
Short-term traders should continue to maintain put options or short equity exposure to address the market risks that I have alluded throughout this commentary. Investors may also think about a portfolio hedge, with the Cboe Volatility Index (VIX - 16.09) reversing from a high near 20 early last week before settling Friday just above 16.00, near the 2017 closing high.
Continue reading: