
CoT large speculators are in a rare net long position on VIX futures, which means volatility could decline
"'At some point, maybe now, this 200-day breach will signal bearish activity to come. But there have been many 'false negatives' along the way too in which the break of this trendline occurred around major lows.'
"...That said, there is often a volatile, choppy phase that equity markets endure in the following weeks and months after a break of this trendline. Whether the current breach signals a bear-market phase remains to be seen... One moving average that I have used is the 80-week moving average ... [which] has had an uncanny knack for signaling poor future price action on breakdowns, while also marking support during various market drawdowns.
"Again, it can be dangerous to continually draw lines in the sand, but it's also hard to ignore how this longer-term moving average marked bottoms during this bull market in 2010, 2012, 2014, and 2016 (a pattern that has occurred every two years). In fact, it was the site of Friday's low around 2,640."
-- Monday Morning Outlook, October 29, 2018
In discussing long-term moving averages last week, I was referring to the E-mini S&P futures contract in response to an article in The Wall Street Journal that had pointed out the break below its 200-day moving average. My discussion last week about the historical significance of the 80-week moving average also applied to the S&P 500 Index (SPX - 2,723.06) and SPDR S&P 500 ETF Trust (SPY - 271.89), and the fact that more often than not, breaches of the 200-day moving average have signaled lows or near-lows during this bull market cycle -- though volatile, choppy price action frequently occurs in the days and weeks following the breakdown.
Judging from the action last week, a low may be in, but the jury is still out. The SPY and SPX advanced sharply from the 80-week moving averages, their respective year-to-date breakeven points, and levels that are 10% below their September all-time closing highs. Moreover, the SPY rallied above peak put open interest at the 265 strike in the standard November expiration series, but the SPX rally from one half-century mark (2,650) was stopped short at another half-century mark (2,750) on Friday. I have mentioned the significance of half-century marks as hesitation or pivot points in past commentaries.
Finding support in the 2,640-2,670 (SPY $264-$267) area is encouraging -- levels that range from the 80-week moving average, the 2017 close, and 10% below the September high. Additionally, the site of the May breakout at SPX 2,710 and SPY $271 held at last week's close. But we are not out of the woods, as the SPY and SPX found resistance at their closing levels on the day of the 200-day moving average breach. The SPY chart below provides a visual of the levels that I discussed above.

"For bulls, last week's Cboe Volatility Index (VIX - 24.16) close below 25.15, half this year's intraday high at 50.30, is somewhat encouraging. However, that is offset by the discouraging mid-October low in the 17-18 area that marks last year's high, double this year's closing low, and half the 2018 closing high."
-- Monday Morning Outlook, October 29, 2018
Staying on the topic of levels, last week's action in the Cboe Volatility Index (VIX - 19.51) is worth mentioning. Early last week, on an intraday basis, the VIX popped back above 25.15, which is half its intraday 2018 high. A subsequent retreat during the week pushed the VIX below 18.66, or half its 2018 closing high in Friday morning's opening hour. This intraday moved proved only temporary, as volatility buyers came in, pushing the VIX higher off this recent support area as equities declined sharply from the morning highs. A VIX close above 25.15 or below 18.66 could hint at the direction of the equity market's next move out of what could be an SPX trading range between 2,650 and 2,750.

"Large speculators in VIX futures, per the weekly Commitments of Traders (CoT) report, are very close to moving into a net long position... whenever this group has moved into a net long position, which they are close to doing, it is not only rare, but it comes at peaks in volatility. The action in the CoT report is one of the stronger cases one can make about volatility being at or very near a peak."
-- Monday Morning Outlook, October 29, 2018
Friday's Commitments of Traders report (CoT) revealed that large speculators are now net long VIX futures, albeit barely. Going long VIX futures is considered an extreme for this group -- and given how they have been dead wrong at extremes, it would not be a bad bet to speculate on declining volatility. The risk is this group being correct for once.

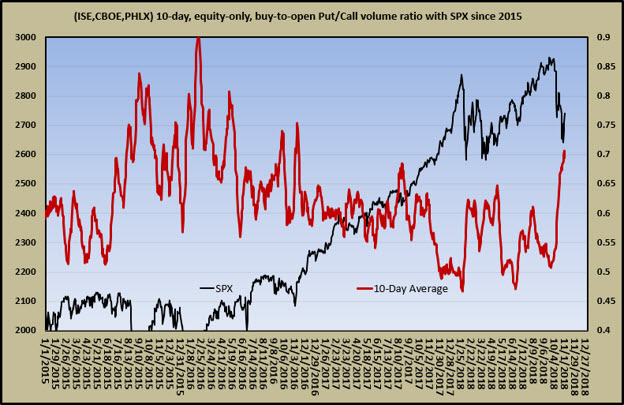
With the SPX and VIX bouncing between potential support and resistance levels, the all-equity, 10-day, buy-to-open put/call volume ratio continue to rise, and is now at its highest level since just after the 2016 elections. As I said last week, the absolute level of this ratio is high enough to mark a bottom. However, the fact that it continues to rise -- and has room to rise to its early 2016 peak -- suggests that negative sentiment is still growing, and should give bulls pause at this juncture.
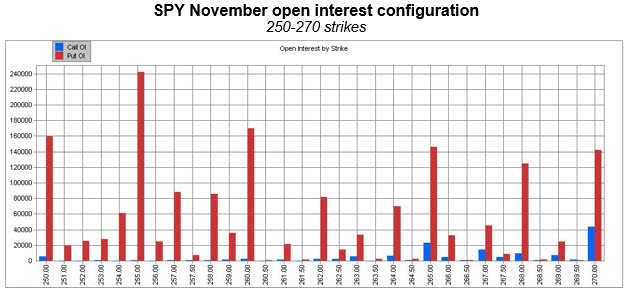
Finally, we are two weeks out from standard November options expiration, so beware that huge open interest on SPY put strikes below the market could exacerbate both downside or upside moves. A sharp move back below the put-heavy 265 and 270 strikes -- the lower of which is in the vicinity of the 80-week moving average -- raises the risk of delta-hedge selling that pushes the SPY down to at least the peak put open interest at the 255 strike, or SPX 2,550. At the same time, if the SPY manages to stay above $265 and $270, the unwinding of short positions related to these puts could be supportive into November expiration.
The outcome of the midterm elections is one "known unknown" on the calendar that could stoke volatile movement in either direction. A few strategies to play these mixed long-term technical signals and sentiment backdrop would include buying short-term calls on pullbacks to support and short-term puts on rallies into resistance. Also, as we move out of the peak reporting season for earnings, individual equity volatility is declining -- which makes strategies like straddles (buying a put and call on the same equity with the same expiration and same strike price) and pair trades (buying a call and put on different stocks in the same sector) attractive.
Continue reading: