"...the sentiment landscape suggests there is fuel to push the market higher. That said, a slew of potential technical resistance levels remain overhead, so be cognizant of these levels to appropriately assess risk. Multiple uncertainties continue to linger -- including the shutdown, as the bill signed by Trump on Friday opens the government only through Feb. 15. Other uncertainties weighing on investors also remain unresolved, whether that relates to the Fed or China-U.S. trade talks."
-- Monday Morning Outlook, January 28, 2019
In last week's commentary, I highlighted a couple of potential resistance levels overhead in the immediate vicinity of the S&P 500 Index (SPX - 2,706.53) -- perhaps some of the more important levels to watch as a "V" bottom takes shape.
I also observed that the sentiment backdrop continues to be a supportive measure for equities after some participants were bracing for doom and gloom in December, specifically: 1) fund investors that withdrew $100 billion in stock funds; 2) equity option buyers, who were buying equity puts relative to calls at the highest rate since 2016; and 3) large speculators on Cboe Volatility Index (VIX - 16.14) futures, who were in a rare net long position anticipating even higher volatility and lower equity prices in the weeks ahead.
This doom-and-gloom scenario is slowly being unwound, and indications are that much of this pessimism has further room to be unwound, which would allow stocks to continue to clear various technical hurdles overhead.
For months, I have been saying that it is all about the Fed, and it was the Fed that helped propel the SPX through one of the more important resistance levels to date. First, the central bank held rates steady in its first Federal Open Market Committee (FOMC) meeting of the year. Long-time readers are by now very familiar with the table below, which highlights how the SPDR S&P 500 ETF Trust (SPY - 270.06) has behaved in the month following a rate hike or rate hold during the tightening cycle that began in December 2015.

Moreover, Fed Chairman Jerome Powell gave investors what they wanted to hear, when he mentioned that the Fed will be patient with future rate hikes and conveyed the possibility of carrying a larger balance sheet than expected, implying a potential light at the end of the tunnel in terms of an end to the current runoff.
Whereas the market interpreted that a Fed "put" was not in play beginning in early October with comments the chairman made, the dovish post-FOMC comments last week from Powell lifted this sense of anxiety as volatility expectations receded and equities popped higher.
"The risk to bulls is a repeat of 2008, when the SPX broke below the 80-week moving average in January, declined into March, and then retested the 80-week moving average in May, but failed to overtake it. After the failure to take back its 80-week moving average in May 2008, the SPX went on to lose about 50% of its value into March 2009..."
-- Monday Morning Outlook, January 28, 2019
In fact, the SPX closed the month of January above its 80-week moving average, which was sitting at 2,678 as we entered trading last week. Per the excerpt immediately above, after the peak in October 2007, a counter-rally move topped out at the SPX's 80-week moving average in May 2008, preceding a huge slide into the ultimate market bottom in March 2009.
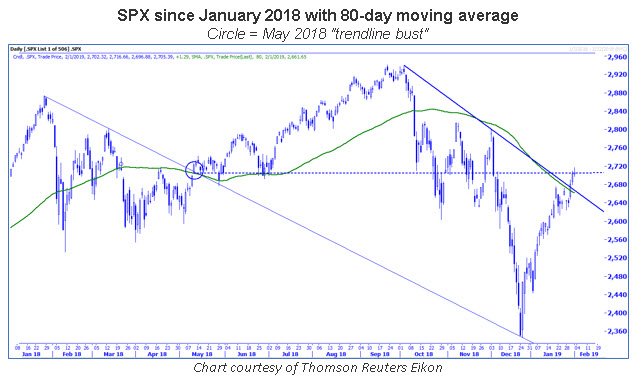
From a shorter-term perspective, the SPX pushed above 2,637, which is 10% below the September 2018 all-time closing high -- a level that was taken out two weeks ago, but which it had failed to close above by that week's end. Moreover, the SPX closed above its 80-day moving average for the first time in nearly four months. The 80-day moving average acted as support during the June 2018 pullback, and the cross below in October 2018 signaled weakness into December.
Finally, the SPX closed above potential trendline resistance connecting the early October high to the early December high on Wednesday, the day the FOMC kept rates steady and Chairman Powell held a dovish press conference. That said, follow-through buying pushed the SPX slightly through the 2,700 century mark, but there seemed to be a "stall" in the 2,705 zone -- which ironically, was the site of the May 2018 breakout area of a potential trendline connecting the January and March 2018 highs. This level acted as support in late June 2018, too (see the chart immediately below).
We will see immediately if the early October and early December peaks carry into an early February top as the SPX battles yet another potential area of resistance just above the round 2,700 century mark. And just as the SPX battles 2,700, note how the Russell 2000 Index (RUT - 1,502.05) and Dow Jones Industrial Average (DJI - 25,063.89) are battling round numbers at 1,500 and 25,000, respectively. That said, the Nasdaq Composite (IXIC - 7,263.87) rallied strongly from the round 7,000 level last week.
If you are a short-term trader, and a pullback occurs, the SPX 2,630-2,640 area is a potential line of defense, as this area marks the closing lows in October and November 2018, in addition to Tuesday's close ahead of the outcome of last week's FOMC meeting. As we look ahead to mid-February, the declining trendline that connects the October and December peaks would be at 2,640. Note that a re-test of the line connecting the January and March 2018 highs occurred in late-May 2018.
A second line of defense occurs in the 2,580 zone, or the February and March 2018 lows. If Friday marks a high of some kind, a 61.8% retracement of the December low and Friday high is situated at 2,580.
As I said last week, 80-week moving average crossovers in the past have not necessarily been immediate buy signals, but instead suggests that risk in the longer term is situated at or just below the prior lows. In fact, in 2011, the SPX declined to support at its 160-week moving average just as it did in December. The first weekly close back above the 80-week moving average was met with selling, with the lows occurring just below the prior low. In other words, with the SPX moving above its 80-week moving average last week, the December lows might define the risk to the long-term investor in the months ahead, as opposed to a decline like that of May 2008 through March 2009.

"With the risk of getting whipsawed on daily VIX closes above and below key levels... I found that the 5-day moving average, prior to the VIX explosion in December, bottomed in the 18.03 area in both November and December. With that said, at risk of getting noised out of daily signals, it could be best to look for the VIX's 5-day moving average to close below this important area to signal additional equity strength and volatility weakness in the weeks ahead."
-- Monday Morning Outlook, January 28, 2019
In a follow-up to last week, the 5-day moving average of the VIX finally moved below 18.03, as equities rallied amid some Fed uncertainty being removed. VIX 18.03 is half the December closing high, and it's a level at which this moving average bottomed in late 2018 ahead of the VIX explosion. This could signal lower volatility in the days ahead, even as the SPX trades in another area of potential resistance.
With the government no longer shut down, the Commodity Futures Trading Commission (CTFC) is again updating the net positions of futures market participants via the weekly Commitments of Traders (CoT) report. Large speculators in VIX futures were in a rare net long position as of the Dec. 24 data release, which was the peak in volatility expectations, as measured by the VIX. So again, this group was dead wrong at a major turning point in volatility. We're uncertain as to the net positioning of large speculators at present, which makes it tougher to stand by a call of lower volatility in the days ahead. Unfortunately, it will take a few weeks before the CFTC is caught up.
And speaking of volatility expectations, last week was busy with earnings reports. This is good news for short-term option buyers, as volatility expectations drop on individual equities, making it cheaper to hedge and/or speculate with equity options.
Continue reading: