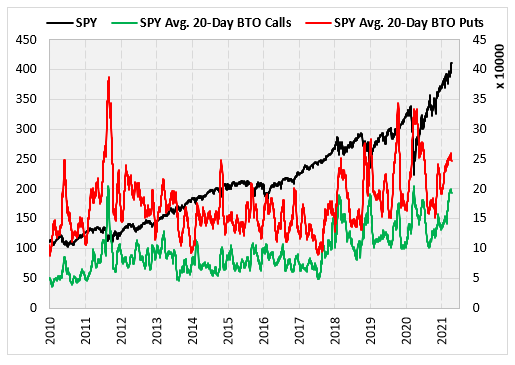
Volume had been relatively steady from 2010 until 2018
The stock market keeps chugging higher, as the SPDR S&P 500 ETF (SPY) just logged an all-time high for the 21st time this year. This week I’m breaking down the buy-to-open (BTO) put/call ratio on the SPY. The data comes from three different exchanges (CBOE, PHLX and ISE) and it only considers option volume which was initiated by buyers.
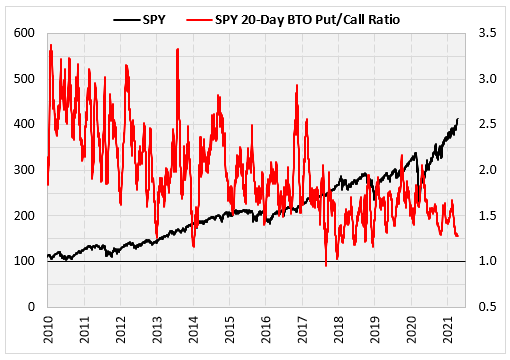
The chart below shows the SPY since 2010 along with the 20-day BTO put/call ratio on SPY options. The ratio is almost always above one, meaning there are more puts bought to open than calls. This is because buying SPY puts is a popular way to hedge stock portfolios. The ratio has been in a general decline since 2010 and it recently hit its lowest point since the end of 2018. Unlike now, however, that was during a severe market pullback.

Breaking Down Buy-to-Open Volume
The volume was relatively steady from 2010 until 2018. Since then, volumes have moved higher with several spikes. The spikes have mostly come during market pullbacks. The volume spike now, however, is while stocks are hitting all-time highs, which I find interesting. Also, while volume is moving higher for both calls and puts, the put volume is significantly lower than the level reached during the past spikes, while the calls are near the peaks of those past spikes. While I generally regard the put buying as hedging, I look at the call buying as more speculative so I would conclude that stock market speculation is starting to ramp up.

I was curious about the implications of these volume spikes while the market was near all-time highs. The table below shows these instances since 2009 (as far back as we have the BTO data). For those curious, I define a volume spike as when the 20-day BTO volume is 20% higher than the average volume over the past year. The bolded rows below interest me most. Those are the only three occurrences in which the 20-day BTO put/call ratio is below 1.50. In other words, those are the times when call volume was most prevalent during the volume spike and the SPY was near an all-time high. They are the only instances that led to negative three-month returns. It’s also the only negative returns one year later. This supports the theory that spiking call volume relative to put volume while stocks are hitting all-time highs, is a caution sign.

The table below summarizes the returns in the table above and compares it to typical SPY returns since 2013. The returns look bullish in the short term and bearish in the longer term (six and 12-month average return is lower than normal). The general returns are less interesting to me than the specific returns I mentioned above where the call volumes are high relative to put volumes.

Finally, here is a chart of the SPY with markers for the signals mentioned above. The red markers are the ones that occurred in which the 20-day BTO put/call ratio was below 1.50. Those two occurred just before a small pullback in the first half of 2018.
