
Many oil & gas stocks are historically bearish in summer months
At the start of every month, Schaeffer's Senior Quantitative Analyst Rocky White distributes the best- and worst-performing stocks on the S&P 500 Index (SPX) in the last 10 years. As we head into a new month, the first thing that stood out when opening the July Excel document was five of the 25 stocks on the "worst" list were oil & gas producers. With gas prices climbing and summer travel season starting to look more like 2019 than 2020, it seemed time to unpack the energy sector for the second half of the year.
It has been an outstanding six-to-12 months for energy. Ethanol, gasoline, crude, and natural gas all occupy the top 10 spots on year-to-date and year-over-year relative performance. According to a sector analysis conducted by White, 83% of oil and gas stocks are above their 80-day moving average, with the 41 stock tickers falling under this umbrella boasting an average year-to-date return of 64.4%. That's the heartiest return of the sectors tracked, comfortably outpacing the second-place travel and leisure sector's 60% 2021 gain.
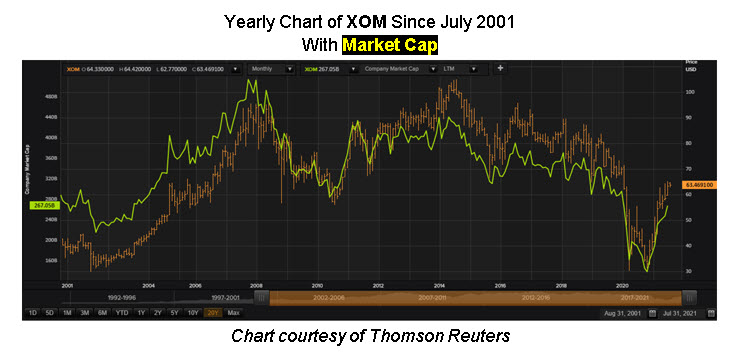
Per White's data, ConocoPhillips (NYSE:COP), Marathon Oil Corporation (NYSE:MRO), and Exxon Mobil (NYSE:XOM) sport July returns of -3.5%, -3.4%, and -2%, respectively. For XOM, only two of the last 10 July's have ended in positive territory. Exxon Mobil's market cap peaked at $500 billion back in 2008, but now sits at roughly half that level.
Consider the Energy Select Sector SPDR Fund ( XLE) posts similarly uninspiring seasonal returns for the summer. In a table curated by Schaeffer's Senior Market Strategist Chris Prybal, you can see below that XLE's monthly returns are lowest in July, August, and September.

It's difficult to say, when looking at the below chart, whether that valuation number will come into any psychological play for XOM. But it is noteworthy that XOM's market cap fell to $133 billion at the Covid-19 lows, which is roughly half the current market cap. On XOM's chart, $59 equates to the $250 billion market cap level, so keep an eye on that area this summer as a potential inflection point.
It's important to keep in mind that when talking about a potential July pullback for the likes of COP, MRO, and XOM, these seasonal dips would still have the stocks within chip-shots from the annual highs wrought earlier this summer. In other words, this isn't so as much predicting a calamitous selling off, and more a short-term pause where bulls can catch their breath or discover an attractive entry point.
Last Thursday, U.S. crude oil prices topped $75 a barrel, the highest level since 2018. This has sparked think-pieces on the allure of electric vehicles, musings on the Organization of the Petroleum Exporting Countries and their allies (OPEC+), and general hand-wringing from the masses as the price to pump hits over $3.
Whether these warning signs are enough to warrant a play or not, implied volatilities of the COP, MRO, and XOM are at comfortable levels for options traders. Their Schaeffer's Volatility Index (SVI) , an average at-the-money (ATM) implied volatility of a stock's front-month options, come in at 31%, 48%, and 25%,respectively, all ranking below the 10th percentile of their respective annual ranges. This underscores an attractive buying opportunity for all three securities – regardless of what the seasonal trends could be hinting at.
Subscribers to Bernie Schaeffer's Chart of the Week received this commentary on Sunday, July 4.