Earnings Season Highlights

Refresh your browser for the latest updates!
A collection of noteworthy post-earnings reactions
Published on Feb 18, 2025 at 2:49 PM
  • Quantitative Analysis

Aerospace and defense stock Kratos Defense and Security Solutions Inc (NASDAQ:KTOS) is headed for its eighth loss in the last nine sessions, down 0.7% at $26.97 and falling further from its recent Jan. 22, 18-year high of $35.66. A short-term bounce could soon be in the cards, however, as the equity is flashing a historically bullish signal on the charts. 

Per Schaeffer's Senior Quantitative Analyst Rocky White, the stock has pulled back to its ascending 128-day moving average. Specifically, the stock is within 0.75 of the trendline's average true range's (ATR), or 20-day ATR, for the first time in at least eight of the past 10 trading days, after spending at least 75% of the last six months above it.

KTOS Feb18

KTOS has seen five similar signals over the past three years, after which the stock was higher one month later 100% of the time with an average 13.6% pop. From its current perch, a similar move would push the stock back up past the $30 level. 

Furthermore, KTOS' 14-day relative strength index (RSI) of 20.5 sits in "oversold" territory, which is typically indicative of a short-term bounce. Despite being down 19.3% since the start of the month, the shares are still outperforming with a roughly 30% year-over-year gain. 

Published on Feb 18, 2025 at 12:45 PM
  • Buzz Stocks
  • Intraday Option Activity

Shares of semiconductor giant Intel Corp (NASDAQ:INTC) stock are experiencing a significant surge following reports that the chipmaker is once again at the center of acquisition talks. According to the Wall Street Journal, Broadcom Inc (NASDAQ:AVGO) and Taiwan Semiconductor Mfg. Co. Ltd. (NYSE:TSM) are both exploring bids that could potentially lead to a breakup of Intel.

Broadcom is reportedly eyeing Intel’s chip design unit, while TSM is considering acquiring its manufacturing operations. However, restructuring Intel’s factories to align with TSM’s processes could be a complex and costly endeavor. If these acquisitions go through, they could significantly reshape Intel’s business model and competitive positioning in the semiconductor industry.

Intel Stock Surges on Acquisition News

Following the acquisition reports, Intel stock was last seen 9.6% higher at $25.87, marking its best trading day since October 2022. INTC has enjoyed an impressive start to 2025, boasting a 28.6% year-to-date gain and reaching its highest level since early November 2024.

The equity is seeing higher-than-usual intraday options volume, with 833,000 calls and 267,000 puts traded so far -- 3 times the amount typical for this point in trading. New positions are opening at the most popular contract, the February 26 call.

Broadcom and Taiwan Semiconductor Stock Movements

Broadcom stock is moving lower, last seen down 2.8% at $226.37. The security recently fell below key support at the $230 level and is now down 2.1% in 2025. AVGO maintains long-term strength, however, up 82.2% over the past 12 months.

Taiwan Semiconductor stock was also last seen lower as well, down 0.8% at $202.29. Despite the minor dip, TSM maintains a 2.4% year-to-date lead and a robust 59% increase over the past year. The stock continues to find support around the $200 level and remains within reach of its all-time high of $226.40, set on Jan. 24, 2025

Published on Feb 18, 2025 at 12:12 PM
Updated on Feb 18, 2025 at 12:12 PM
  • Midday Market Check

4 .


Published on Feb 18, 2025 at 11:02 AM
  • Buzz Stocks

Shares of Bank of America Corp (NYSE:BAC) and Citigroup Inc (NYSE:C) are lower today, after Warren Buffett's Berkshire Hathaway (BRK) lowered its stake in both banks by 15% and 74%, respectively.  Meanwhile, Occidental Petroleum Corp (NYSE:OXY) stock is higher, as the oil name -- which Buffett also partially owns -- gears up to report fourth-quarter result after the close.

BAC Fresh Off Weekly Loss 

BAC is down 1.2% to trade at $46.39 at last glance, chipping away at its 36.2% year-to-date lead. Fresh off their fourth weekly loss in five, shares have struggled to move back above the $48 level since conquering their Nov. 29, three-year high of $48.08, while the 40-day moving average has been providing support since mid-January.

C Looks to Snap Win Streak

C was last seen down 0.9% to trade at $83.86, looking to snap a four-day win streak as it pulls back from its Feb. 13, roughly 17-year high of $84.67. Shares still boast a 53.1% year-over-year lead, however, and already added more than 19% in 2025, with support from their 20-day trendline.

OXY Eyes 3rd-Straight Gain

OXY is up 1.2% to trade at $48.64 at last check, but carries a 23.6% nine-month deficit. The security is pacing for a third-straight gain, however, though overhead pressure at the 40-day moving average lingers. The stock has an encouraging history of post-earnings reactions, finishing five of the last eight next-day sessions higher, averaging a move of 2.5% over the past two years, regardless of direction. This time, the options pits are pricing in a much larger swing of 6.4%. 

Published on Feb 18, 2025 at 10:57 AM
  • Buzz Stocks

Delta Air Lines Inc (NASDAQ:DAL) is in focus after the highly publicized Toronto crash on Monday, in which a flight from Minneapolis, operated by the carrier's regional jet subsidiary Endeavor Air, flipped upside down at Toronto Pearson International Airport. All 80 passengers and crew members were accounted for after evacuation, with those hurt reportedly only sustaining minor injuries. 

At last glance, DAL was down 0.4% at $65.15. The stock isn't too far removed from its Jan. 22, record high of $69.98, carrying a 62.4% year-over-year lead. Plus, long-term support at the 80-day moving average helped capture last week's pullback. 

Southwest Airlines Co (NYSE:LUV) also garnered attention yesterday, after announcing its first mass layoffs in company history. The 1,750 employees that will be laid off at Love Field in Dallas equate to roughly 15% of the air line's corporate positions. 

Southwest Airlines stock has pulled back from its early morning surge, last seen trading near breakeven at $30.28. On the charts, shares have been chopping lower since their Dec. 5, 52-week high of $36.12. More recently, LUV bounced off the 200-day moving average and finished the last three sessions higher. Year over year, the equity is down 10.7%. 


Published on Feb 18, 2025 at 10:50 AM
Updated on Feb 18, 2025 at 10:50 AM
  • Editor's Pick
 
Published on Feb 18, 2025 at 9:10 AM
Updated on Feb 18, 2025 at 9:18 AM
  • Opening View
 
Published on Feb 18, 2025 at 9:17 AM
  • Earnings Preview
  • Analyst Update

Snowflake Inc (NYSE:SNOW) stock was last seen 3% higher at $193.50 in pre-market trading, after Wolfe Research upgraded its rating to "outperform" from "peer perform" with a price target of $235. The analyst cited improving consumption trends, a better competitive environment among hyperscalers, and strong product momentum ahead of the cloud company's fourth-quarter earnings on Feb. 26. 

Fresh off its seventh consecutive weekly gain, SNOW already boasts a 21.5% year-to-date lead. The equity has added 48.9% over the last three months, with a major boost stemming from a mid-November post-earnings bull gap that saw it gain 32.7%. Snowflake stock is now trading at its highest level since February 2024.

While most analysts are already bullish on the shares, there's still room for some pessimism to unwind. Specifically, 10 brokerages maintain a "hold" or worse rating, and the stock could see additional upside if these firms adjust their outlooks higher.

Snowflake stock doesn’t typically perform well after earnings, with its massive mid-November gain being an exception. The stock closed lower in six of the past eight post-earnings sessions, including a 14.7% drop in August. SNOW has averaged a 14% move in either direction over the past two years, though options traders are pricing in a slightly smaller-than-usual 13.6% swing this time.

Published on Feb 18, 2025 at 8:58 AM
  • Monday Morning Outlook

Last week, investors absorbed more headlines on tariffs, plus Fed Chairman Jerome Powell’s testimony to Congress, inflation data, and the release of the January consumer price index (CPI) and producer price index (PPI) reports.

“One scenario worth considering is that the 10-year yield is sitting on potential support from its 80-day moving average and the November closing high ahead of inflation data this week. If the retreat from higher yields since mid-January is over, a potential headwind for equity bulls is higher 10-year yields stemming from higher-than-expected inflation data on Wednesday and Thursday.”

            -Monday Morning Outlook, February 10, 2025

Per the excerpt above, in response to hotter-than-expected CPI data, yields on the 10-year Treasury note popped from levels I anticipated could be supportive ahead of the release of the inflation data. The knee-jerk reaction resulted in a pullback from equities too. But, per the chart below, the yield on the treasury note peaked on Wednesday, even with hotter-than-expected PPI data on Thursday morning. 

By Friday’s close, the 10-year Treasury yield had done a round trip, closing the week at around the same level as the previous Friday’s close.

mmo 1 feb18

“…given that there still has not been a close above the Jan. 24 close (that preceded the Jan. 27 gap lower) at 6,101, the risk to bulls is the bearish ‘island reversal’ still in play…Bulls, on the other hand, are hopeful that the bearish pattern simply signaled choppy short-term price actionthe SPX is just above multiple potential support levels, but also just below previous highs attained last month between 6,119 (the all-time closing high) and 6,128 (the all-time intraday high)… The first key level...is 6,013, which marked highs in November and again in early January… pre-Inauguration Day close of 5,995 in mid-January. As the market reacts to both negative and positive headlines on tariffs, it is of note that the SPX has closed either above or on this level each trading day since the inauguration of President Donald Trump.”

            -Monday Morning Outlook, February 10, 2025

In retrospect, one would have to grade last week’s price action as a positive for bulls, as the S&P 500 Index (SPX--6,114.63) ultimately closed higher. Moreover, with Thursday's close at 6,115, the benchmark finally closed above the pre-gap close that created a potential bearish “island reversal” pattern.  

But, per the chart below, it had to first test key levels of support that I talked about in last week’s commentary before nullifying the bearish pattern.

For example, the immediate response to Wednesday’s CPI data was a selloff. But note that the intraday low was at 6,003, site of its 50-day moving average, above the round 6,000 millennium level and just six points above the SPX’s close ahead of President Trump’s Inauguration Day at 5,997.

While the SPX has not been positive every day, like Meta Platforms (META) since President Trump took office, the index has not experienced a close below the pre-inauguration close of 5,997, despite two intraday moves below it. 

In fact, on Wednesday, the SPX closed above 6,013, which I also pointed out as a key level since it marked notable short-term highs in November and January.

There is work to be done, however, as Friday’s high was the site of another important area that I discussed last week between 6,119 and 6,128, the site of January’s all-time intraday and closing highs. We enter this week’s trading just below this area, but with multiple levels of potential support just below, including December’s closing high at 6,090.

mmo 2 feb18

“After five straight weeks of net selling, hedge funds snapped up US equities at the fastest pace since November, resulting in the heaviest net buying of single stocks in more than 3 years, according to Goldman Sachs Group Inc.’s prime brokerage report for the week ended on Feb. 7… It was their second largest buying spree in the last five years as they covered covering short bets and added long positions.”

            -Bloomberg, February 10, 2025 

With the SPX and tech-oriented Invesco QQQ Trust (QQQ--538.15) entering the week at prior highs, the question is who or what pushed the index to new all-time highs. With many companies reporting earnings the past couple of weeks, corporate buyback activity could be more in play relative to a few weeks ago.

Equity option buyers on SPX component stocks have been and remain supportive, as put buying relative to call buying has lingered around multi-year lows since the beginning of December. This segment of the market is usually positioned wrong at extremes in sentiment and were most bullish just ahead of the modest decline from mid-December into mid-January. The buy (to open) put/call volume ratio is low from a multi-year perspective, but is also rolling over from a multi-week high, suggesting that if the ratio returns to early-December levels, this group could be behind a breakout.
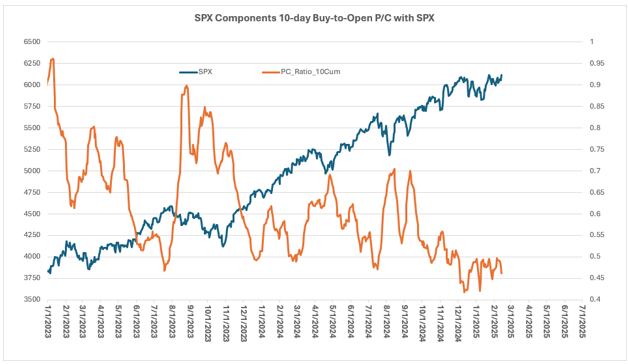
mmo3 feb18

 After the SPX troughed at its Election Day close around 5,780 on Jan. 13, it surged nearly 6% to this past Thursday’s all-time closing high...Short interest figures as of mid-January will come out this week, but it may be the end-of-month data that gives us a better clue as to whether short covering helped support a rally since mid-January.”

            -Monday Morning Outlook, January 27, 2025 

The chart that fascinates me the most and reflects a portion of the excerpt from Bloomberg above, is the potential for a period of sustained short covering. Short interest data as of the end of January was released early last week, and there was a 3% decrease in short interest from mid-January through the end of January.

This answered my question from late-January as to whether short covering may have driven stocks sharply higher from the lows in mid-January that were at the Election Day 2024 close.

The biggest risk to bears, even with the SPX at chart resistance, is a short-covering breakout, with short interest on SPX component stocks now rolling over from multi-year highs.

mmo 4 feb18

Todd Salamone is Schaeffer's Senior V.P. of Research

Continue Reading:

Published on Feb 14, 2025 at 4:27 PM
  • Market Recap
 
Published on Feb 14, 2025 at 1:44 PM
  • Technical Analysis
  • Options Recommendations

Subscribers to Schaeffer's Weekend Trader options recommendation service received this PLTR commentary on Sunday night, along with a detailed options trade recommendation -- including complete entry and exit parameters. Learn more about why Weekend Trader is one of our most popular options trading services.

Palantir Technologies Inc (NASDAQ:PLTR) shares rallied in response to the company’s better-than-expected fourth-quarter report, as well as its upbeat 2025 and fiscal first-quarter outlook. The security took out and retested 10 times its initial public offering (IPO) price at $100, and on Friday was trading at all-time highs. Meanwhile Ark Investment liquidated 30% of its position in the software name, but PLTR moved higher, signaling underlying strength.

PLTR Feb14

Despite the company’s strong showing in the earnings confessional, only one analyst chimed in with an upgrade. The brokerage bunch is largely bearish toward PLTR, with 16 of the 18 firms in coverage sporting a "hold" or worse rating. And while call adds were popular after earnings, the biggest open interest (OI) change beyond the weekly 2/7 expiration was the March 80 put.
 
Short interest coming into 2025 was at multi-month highs and is more than 60% above the 2024 low, indicating Palantir Technologies stock could benefit from a short squeeze. There’s also potential for a post-earnings continuation move, as many sit on the sidelines and await a pullback.
 
Our recommended call option has a leverage ratio of 3.2 and will double on a 22.9% rise in the underlying equity.

Published on Feb 14, 2025 at 1:28 PM
  • 5-Minute Market Rundown
.

Begin the New Year With Schaeffer's 7 FREE 2022 Stock Picks!

1640638248


MORE | MARKETstories


3 Gold Stocks Higher on Record Bullion Prices
Investors are turning to gold as stocks sell off in response to tariffs
Tariffs Send Target Stock to Covid Lows
Target stock is weighing on retail ETFs today