"... [S]tocks have held their own amid a plethora of shorting activity that has pushed total short interest on SPX components to the highest level since June 2018. With a relatively low bar set with respect to earnings, and more clarity on China-U.S. trade, an unwinding of the six-month build in short interest could be what is needed to push the SPX above the top of its range."
-- Monday Morning Outlook, October 14, 2019
"A post-FOMC breakout from the ascending triangle would likely trigger an 8-10% rally into the first quarter of 2020, akin to the short-covering rally that occurred in the second half of 2017."
-- Monday Morning Outlook, October 28, 2019
"In speaking about the prospect for future rate hikes, [Fed Chair Jerome Powell] said the Fed would need to see 'a really significant move up in inflation that's persistent before we would consider raising rates to address inflation concerns.' Markets immediately reacted to this line, with the S&P 500 jumping by about five points. Why? Traders interpreted it as Powell raising the bar for future hikes, because in the past they've increased rates even without a significant, persistent upward move in inflation."
-- Bloomberg, October 31, 2019
With headlines suggesting a phase one U.S.-China trade agreement is in danger one day, then "getting closer" the next day, I am not sure market participants have more clarity on a trade deal just yet. Nonetheless, from a technical perspective, bulls have a lot to cheer following last month's S&P 500 Index (SPX - 3,120.46) breakout from an ascending triangle pattern -- which occurred just after my Oct. 28 commentary discussed the implications of such a breakout, and continued after the Federal Open Market Committee's (FOMC's) decision to cut rates.
Heading into that FOMC meeting, short interest on SPX components was still near a multi-month high, as is evidenced by the Oct. 31 short interest data. Data as of this past Friday will be released sometime next week, and will give us a glimpse as to whether or not any short-covering activity occurred after the technical breakout and Powell's remarks (which apparently gave some investors the green light to go long stocks, based on his word that it would be a while before the Fed entertains the idea of taking back any of the rate cuts that began in late July).
As such, whether it was Powell's assurance that a rate hike is not on the immediate horizon, and/or a build-up in caution in recent months with respect to U.S.-China uncertainty, the stock market has remained relatively resilient amid negative news on trade. We will find out soon whether or not short covering has been supportive of the bullish action in the aftermath of the rate cut a few weeks ago.

But if the action of equity option buyers is indicative of what the shorts are up to recently, it appears covering activity could well be helping drive the current rally. Specifically, we are noticing that equity option buyers are in the early innings of unwinding a multi-month high in caution that built up heading into this month. This is revealed by the 10-day moving average of the equity-only, buy-to-open put/call volume ratio, which is swiftly turning lower from its recent peak. While this ratio is moving lower as equity option buyers purchase fewer puts relative to calls, the ratio still has room to move lower before it gets to a level that has historically suggested stocks are vulnerable in the short term.

While the SPX has broken out above the psychologically important 3,000 level, and is well north of the round 20% year-to-date (YTD) gain that has capped rallies this year, the 3,100 century mark acted as resistance early last week before the SPX finally pushed through on Friday.
SPX 3,100 is equivalent to the SPDR S&P 500 ETF Trust (SPY - 311.79) 310 strike. During the past week, we were curiously watching whether or not the SPY could sustain a move through this level because, on Oct. 4, more than 100,000 December 310 calls were purchased when the SPY was trading in the $294 area. The December 310 calls were not very sensitive to SPY movement early in the trade, but they have since become increasingly more sensitive to SPY movement -- requiring those who sold the calls to buy more S&P futures as a hedge. Given the time until expiration, with this option barely in the money, the sensitivity to SPY movement can still increase as long as SPY remains above $310, which is a small tailwind in the weeks ahead.
But if the SPY moves back below $310 as standard December options expiration nears, a headwind could emerge as the call options' sensitivity to SPY movement decreases. While the call purchases could have been speculative in nature, or a hedge to a basket of short SPX components or a SPY short position, we have not seen any notable liquidations at this strike, which could also be a small headwind.
With the SPX's latest battle coming at the 3,100 century mark, other major equity benchmarks are battling round numbers simultaneously, which could be a speed bump in the next few days or weeks as they approach or continue to work off overbought conditions. Whether it is the Russell 2000 Index (RUT - 1,596.45) or S&P MidCap 400 Index (MID - 2,000.61), levels that have persistently provided resistance in the past are being challenged once again. For more on this, check out Bernie Schaeffer's recent commentary on the MID 2,000 level.

The RUT's price action mirrors both the MID and SPX, recently breaking out of a descending triangle pattern (like the SPX) as it looks to take out the 1,600-century mark that has acted as resistance on multiple occasions since January 2018 (like the MID).
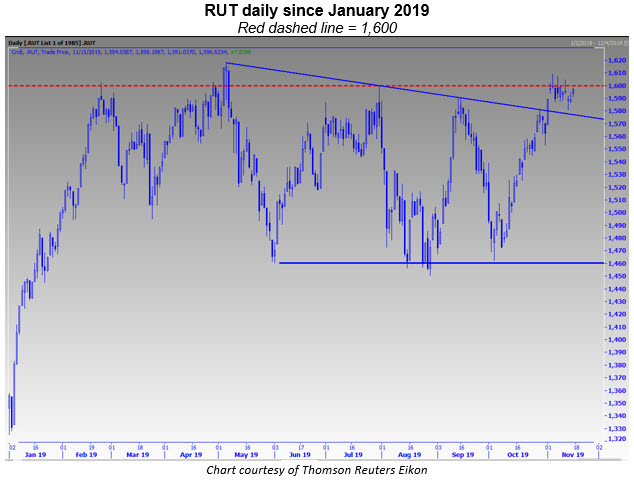
The RUT's descending triangle breakout two weeks ago targets a 7.5% move higher during the next four months to the round 1,700 level. With some technicians voicing concerns about few stocks participating in the rally, a 7.5% jump might take many by surprise. And, in fact, short covering could be a driver of small-caps too, as short interest on Russell 2000 components is barely below a record high.

With earnings-related risk passing as third-quarter reporting season winds down, and a Fed meeting out of the way and many Fed officials having voiced their opinions in the last week, trade deal and Brexit uncertainties continue to persist. With that, the risk is what I am seeing in volatility, as wrong-way large speculators continue to hold an extreme net short position on Cboe Volatility Index (VIX - 12.05) futures, per the weekly Commitments of Traders (CoT) reports.
Moreover, volatility pops have occurred in the past as SPX historical volatility (HV) approaches 5, as it is doing now. The VIX futures "premium" over SPX HV is now rising to levels from which stocks have experienced corrections in the past, with the one exception over the past couple of years being 2017, when short covering helped drive a second-half rally. Therefore, if the final quarter of 2019 and first quarter of 2020 resemble the second half of 2017, it could be short covering that keeps volatility compressed during the next few months.

But nothing is certain -- so buying VIX calls in anticipation of large speculators eventually being on the wrong side of the next major volatility move, or call options on the iShares 20+ Year Treasury Bond ETF (TLT - 137.76) after it recently bottomed at its 160-day moving average and round 10% YTD level, could be worthwhile hedges to a long equity portfolio.
Todd Salamone is Schaeffer's Senior V.P. of Research.
Continue reading: